Volatility has increased across financial markets in recent months, reflecting two differing interpretations of the current economic environment. Strong global demand fostered confidence in the outlook for industrial and cyclical industries and heightened uncertainties about global demand’s impact on inflation and interest rates, which penalized interest-rate sensitive assets. Additionally, concerns over the health of the U.S. housing and corporate credit markets have introduced further doubts about global economic prospects. This resurgence of uncertainty around future economic developments translated into higher short-term market volatility. In this paper, we employ quantitative techniques to explain the causes of the rise in systematic risks observed on the market.
Investment risks can be divided into systematic and unsystematic risks. Systematic risks refer to non-diversifiable risk factors and are compensated by an expected risk premium. Unsystematic risks, which are investment specific, are idiosyncratic and can be minimized through diversification. While unsystematic risks are known to mainly reflect microeconomic shocks affecting assets’ relative prices, systematic risks are recognized to mainly reflect macroeconomic shocks. In this paper, we employ a framework that decomposes observed levels of market volatility or systematic risk into key fundamental economic and financial variables. Systematic risks, the implicit market price of risk, merely become a function of the selected fundamental explanatory variables introduced in the model. Employing this approach provides an unambiguous and statistically sound approach to explaining the causes and evolution of systematic risks.
To isolate these explanatory variables, we rely on a rigorous and disciplined statistical approach, built on the following precepts:
– Consistency with economic theory and practice: a wide array of economic and market factors are selected and tested.
– Consistency across market and business cycles: Macroeconomic and financial factors are chosen for their ability to explain volatility’s dynamics over multiple economic cycles.
– Capture volatility’s probability distribution function: Relevant financial factors are included to map volatility’s asymmetric probability distribution function.
– Capture dynamic market features: Interaction between economic and financial signals and the variations in volatility’s features.
We explore the contemporaneous relationship between a set of financial and economic fundamental variables and the S&P500 implied volatility index. Theory and empirical evidence suggest that the weekly log-differences of the implied volatility index can be explained in order of importance by
1. The weekly positive and negative log-differences in the underlying stock index (capturing the asymmetric effect of index returns on implied volatility),
2. The weekly log-differences in historical volatility,
3. The weekly log-differences in the slope of the yield curve calculated as the difference between the yield of the ten year government bond and the one-month US interbank interest rate,
4. The weekly log-differences in the volume of open futures contract on the underlying index,
5. The weekly log-differences in the one-month US interbank interest rate,
6. The weekly log-differences in oil prices (WTI/Brent Crude Oil price),
7. And the weekly log-differences in the US Dollar basket.
Most of these variables consistently affect the value of an implied volatility index, some occasionally.
Figure1: Relative Explanatory Power of Selected Variables

Figure2: Value of Selected Explanatory Variables

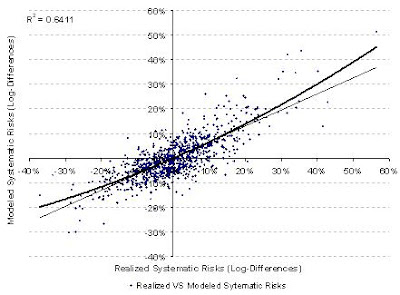
Figure3: Realized versus Modeled Systematic Risks
We observe two well documented phenomena; a positive relationship between the historical and implied volatility indices (clustering effect), and a negative relationship between the implied volatility index and the underlying stock returns. This second phenomenon is asymmetric in nature; negative index returns have a greater impact on implied volatility as an increase in the equity of the firm decreases the firms’ debt to equity ratio (leverage effect) and therefore risks.
The effects of changes in the yield curve (level and slope) are unclear; as an increase in interest rates decreases both the value of debt and equity. The effect of increasing interest rates on firms’ debt to equity ratio and hence on volatility is as a result ambiguous. Additionally, the effects of higher short-term interest rates over the period were typically offset by a flattening or inversion of the yield curve.
In addition, domestic currency appreciation has led to decreases in systematic risks in the domestic economy. Similarly, an increase in oil prices increases the uncertainty in the economy and hence is expected to increase systematic risks. Finally, the volume of contracts traded in the underlying index is expected to be positively correlated with systematic risks.
Based on our volatility model, all significant factors can be considered when inferring the evolution of future short-term volatility levels.
1. Important oscillations in stock indices should sustain higher levels of systematic risks
2. Higher levels of historical volatility should cause comparatively higher levels of systematic risks (clustering effect)
3. The effect of lower short-term interest rate should in part be offset by a steeper slope of the yield curve
4. Continued depreciation of the U.S. Dollar and higher crude oil and commodity prices should also corroborate to higher systematic risks
For more information, please see http://www.qmsadv.com/ or send your inquiries to info@qmsadv.com